My Role
As the design lead for Microsoft Fabric’s developer experience, I, along with a talented global team of designers, researchers, product managers, and engineers, set out to revolutionize how data professionals interact with their analytics tools.
My team members based from all over the world - China, India, Canada, and the USA to deliver one mission - make data science as frictionless, collaborative, and powerful as possible - all while driving tangible business value for Microsoft Fabric.
My Product Portfolio
Here is a list of products I'm responsible for:

Fabric Data Engineering

Fabric Data Science

Notebook

Environment

ML Model

Experiment

Data Agent

Data Wrangler

Spark jobs

Scope jobs

Copilot

VS Code Extensions

Materialized Lake Views
Delivering strong business results.
MAU Up 180%
in monthly active user growth since Jan 2025.
Usage Up 167%
in total usage consumption since Jan 2025.
Retention 85%
in percent of users who remain continuously active by the end of Sep 2025.
Over 20K customers
By the end of March 2025, Fabric announced that the customer base has grown 75% in the last year, from 11000 to over 19000.
Over 150K users
By the end of Sep 2025, Notebook has grown to 150K.
Trusted AI
Since the start of 2025, Copilot usage in notebook has increased by 148%, remaining from the developer community.
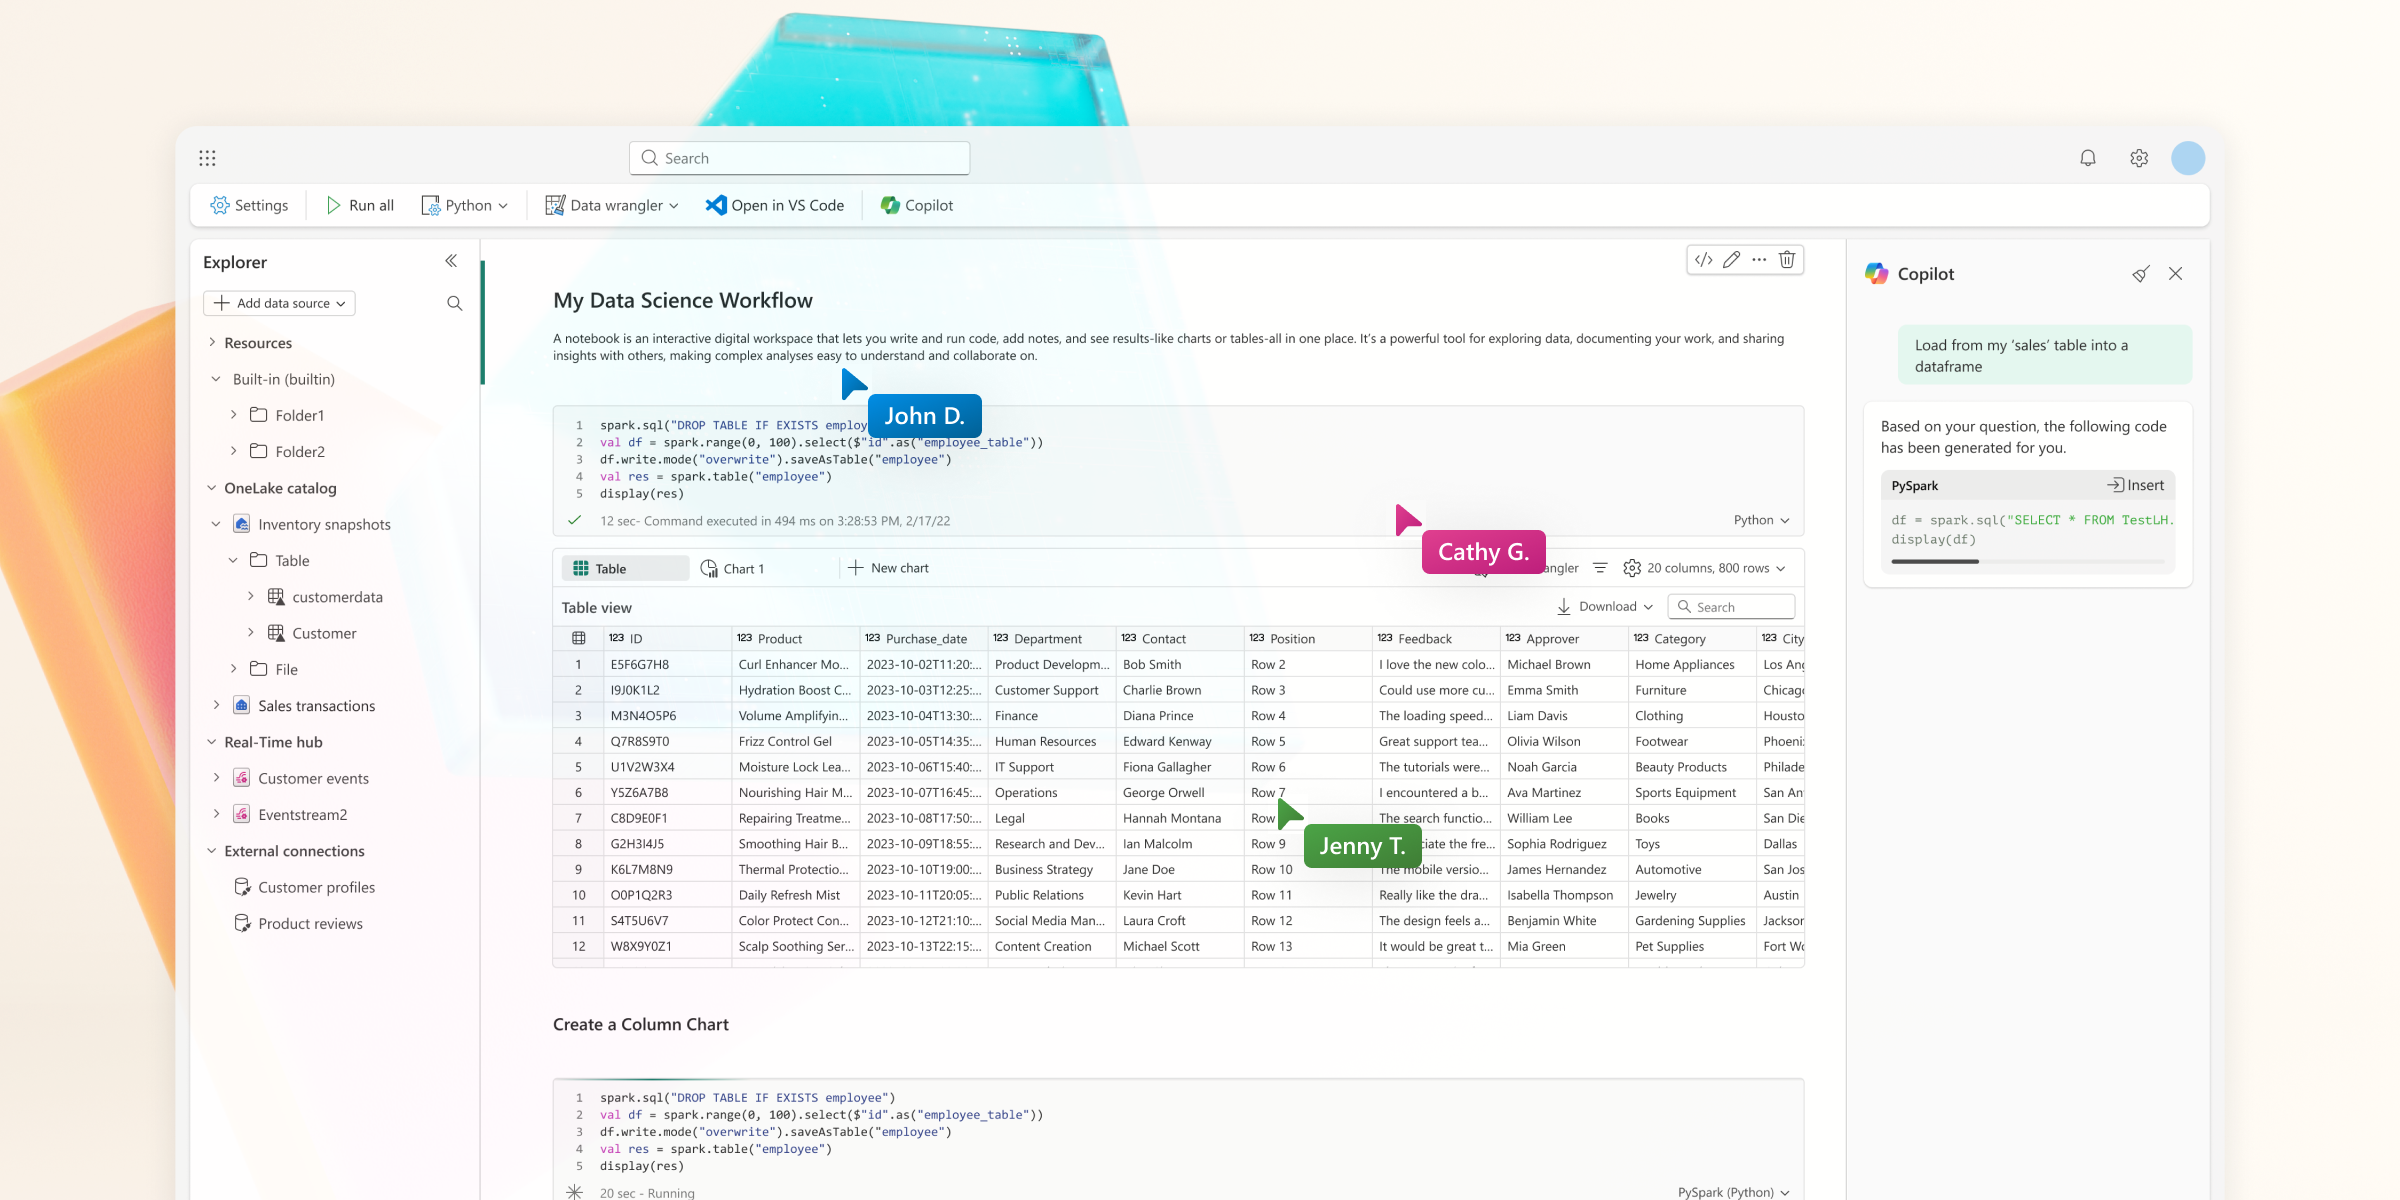
Notebook is a core feature in Fabric developer experiences. It's an interactive coding environment where data scientists write code, experiment, and collaborate all in one place, making it easy to explore data and share insights.
Our UX Challenges: Coding Coding experience is broken
User research
Research process
Method: 60 minute 1-on-1 sessions of usability testing coding products.
Participants: 4 data engineers and 4 data scientists.
Theme: Semi-structured interviews and allows free explorations.
We conducted user research that included interviews, testing, and direct observation of data scientists and engineers in their daily workflows. By listening to their experiences and watching how they interacted with coding tools, we uncovered common pain points such as slow performance, complicated setup processes, difficulties with collaboration, and concerns about data security.
Conclusions
Users spent majority of their time fighting tools instead of finding insights. They faced a minefield of obstacles:
• Setup Nightmares: Spend hours install languages configuring environments.
• Lag & Frustration: Slow performance for handling large scale data.
• Collaboration Chaos: Sharing work meant endless email threads and versions.
• Need Help with Coding: Spend hours searching for coding solutions on GitHub and developer forums.
Our Vision
Make Fabric Notebook a go-to coding tool for every data project.
Stellar performance
Learn the core workflow in minutes, not hours. No more waiting, just coding and running with built-in features to power innovation.
Real-time collaboration
Supercharge teamwork by letting multiple people code in different languages, comment, and brainstorm together instantly.
AI-Assisted coding
Get help for coding and debugging from AI directly in notebook, answers within seconds.
Frictionless Onboarding
Research process
We started collecting feedback from analytics tools and conducting empathy-interviews. One of the most frequently received feedback was that developers have a hard time familiarizing with the notebook interface and understanding what new features have been released.
First-time onboarding tour
The initial experience a customer has with a product is vital. The aim of the first-run experience (FRE) is to ensure users quickly understand the product's value. Direct them simply and clearly to their starting point, minimizing obstacles and unnecessary friction for a smooth and rewarding beginning.
New feature awareness
Properly introducing new features helps keep users aware of updates and boost feature adoptions. Use non-intrusive methods like in-context prompts or tooltips that fit seamlessly into the user's workflow. Present features when they are most relevant to boost engagement and adoption.
Easy Setup and Lightening performance
Research process
Method: Benchmark think-aloud interviews, 90-minute 1:1 sessions.
Participants: 12 data engineers and 12 data scientists.
Theme: End to end data engineering benchmark study.
We conducted user interviews that focuses on first-time users for Fabric who had experience with other online coding tools. In the research, each participant was assigned a list of routine tasks for data engineering workflow, the tasks includes getting data, transforming data, and visualizing data. The participants were asked to performed the same tasks on Fabric and other tools with a random order. The task success were recorded in both behavioral measures (success rate and completion time) and attitudinal measures (how difficult the users feel when working on Fabric vs. other tools. High-level paint points are shared below:

Issue #1: Difficult Setup
To start coding, data engineers and scientists must set up a proper environment. It takes hours for every data projects to install all their preferred languages, libraries, and properties in the right version.

Issue #2: Slow Performance
To run codes, the market standards is to take around 15 minutes to start a session. It is perceived as "too slow", and one of the reason data scientists do not prefer web solutions for programming.

Issue #3: High Dependency
To transform or visualize data, data engineers and scientists need to rely on public libraries, which are sometimes laggy and unreliable. Advanced tooling usually adds up the costs of operations.
Lightening-fast start up
We optimized backend performance and introduced intuitive defaults, letting users start coding in under 5 seconds—no setup, installations, or configurations needed. This dramatically boosts productivity.
Advanced built-in visuals
We developed intuitive UI gestures and automated code generation, letting users create AI-powered charts and reports instantly—no setup or libraries needed. This innovation greatly improved efficiency and user experience.
User Validation
Method: Competition benchmark, 90-minute 1:1 sessions.
Participants: 12 data engineers and 12 data scientists.
Theme: End to end data engineering benchmark study.
As a result, the Fabric notebook has the highest outcomes compared to major market competitors.
secure real-time collaboration by design
Research process
Method: Interview and wireframe testing, 90-min 1:1 sessions.
Participants: 9 participants across data engineers, scientists, and analysts with various coding experience.
Theme: Notebook collaboration testing.
Users love collaborating in coding, especially when they can see what others are working on in real-time. However, the lack of supporting features concern users. When coding on the same project, users expressed concerns about changing other's work accidentally, going back and forth with questions, exposing sensitive data to collaborators who should not have permissions.
Real-time collaboration supercharged
Fabric notebooks supercharge teamwork with real-time collaboration, letting users code in multiple languages, comment, and brainstorm together instantly. With live updates, in-line feedback, and comments on specific code cells, teams can solve problems faster, share insights seamlessly, and stay in sync.
Version history safeguarded
We built robust version control that auto-saves checkpoints, supports manual milestones, and enables tracking, comparing, and restoring work. For advanced collaboration, Fabric’s Git integration lets users back up notebooks, revert stages, and manage content within the environment.
User Validation
Method: In-product feedback toolThrough our feedback tool, users expressed one concern for real-time collaboration feature - afraid of irreversible changes to others' work. This stops them of freely collaborating.
AI assisted Coding
Research process
Method: Survey study taking around 12 minutes
Participants: 183 data professionals
Our research team sent out a survey to attendees for Fabric Conference in Las Vegas. The survey attempted to capture insights on changes in the landscape of AI tools utilization, and how data professionals are using AI in their daily work.
As a result, 87% of all respondents have low to intermediate levels of familiarity with A tools, but 90% of respondents are willing to adopt AI tools into their data workflows. Across all surveyed AI tools, ChatGPT is rated the most common and most helpful, followed by Microsoft Copilot. Two major concerns of frequently integrating AI into data workflow: 1) data security - not trusted to share data with AI tools, and 2) inefficiency to provide context to AI tools.
It gives us an advantage to build the AI-assistant tool inside of notebook, because the data are not shared outside of Fabric, and notebook automatically understands the context of all content.
Notebook Copilot
Copilot in Fabric notebooks helps you generate code, fix errors, and optimize workflows through interactive, context-aware AI assistance. Just ask in natural language for insights or visualizations.